Peer Review10.5194/egusphere-2023-2990-ac1
Reply on RC1
Torsten Albrecht
- 14 May 2024
TL;DR: The dynamics of ice sheets on glacial-interglacial time scales are controlled by interactions with the solid Earth. Feedback mechanisms govern the migration of the ice sheet's grounding line and hence the ice sheet stability. This study investigates the coupling between ice sheet and solid Earth models and finds that feedback mechanisms can significantly slow-down grounding line retreat.
read more
Abstract: <strong class="journal-contentHeaderColor">Abstract.</strong> The dynamics of the ice sheets on glacial-interglacial time scales are highly controlled by interactions with the solid Earth, i.e., glacial isostatic adjustment (GIA). Particularly at marine ice sheets, competing feedback mechanisms govern the migration of the ice sheet's grounding line and hence the ice sheet stability. In this study, we run coupled ice sheet–solid Earth simulations over the last two glacial cycles. For the ice sheet dynamics we apply the Parallel Ice Sheet Model PISM and for the load response of the solid Earth we use the three-dimensional viscoelastic Earth model VILMA, which, in addition, considers the gravitationally consistent redistribution of water (the sea level equation). We decided on an offline coupling between the two model components. By convergence of trajectories of the Antarctic Ice Sheet deglaciation we determine optimal coupling time step and spatial resolution and compare patterns of inferred relative sea level change since the Last Glacial Maximum with the results from previous studies. With our coupling setup we evaluate the relevance of feedback mechanisms for the glaciation and deglaciation phases in Antarctica considering different 3D Earth structures resulting in a range of load-response time scales. For rather long time scales, in a glacial climate associated with far-field sea level low stand, we find grounding line advance up to the edge of the continental shelf mainly in West Antarctica, dominated by a self-amplifying GIA feedback, which we call the `forebulge feedback'. For the much shorter time scale of deglaciation, dominated by the Marine Ice Sheet Instability, our simulations suggest that the stabilizing GIA feedback can significantly slow-down grounding line retreat in the Ross sector, which is dominated by a very weak Earth structure (i.e. low mantle viscosity and thin lithosphere). This delaying effect prevents a Holocene grounding line retreat beyond its present-day location, which is discussed in the scientific community, supported by observational evidence at the Siple Coast and by previous model simulations. The described coupled framework, PISM-VILMA, allows for defining restart states to run multiple sensitivity simulations from. It can be easily implemented in Earth System Models (ESMs) and provides the tools to gain a better understanding of ice sheet stability on glacial time scales as well as in a warmer future climate.
read more
Chat with Paper
AI Agents for this Paper
Find similar papers on Google Scholar, PubMed and Arxiv
Write a critical review of this paper
Analyze citations of this paper to find unaddressed research gaps
Figures

Figure 5. VILMA Earth structure. a) Vertical profiles down to 1000 km depth for 3D Earth structures, with global log-mean and range (grey), the Antarctic wide range (between orange and blue defining ‘3D min’ and ‘3D max’, respectively) and the two-layer profile as used in the Lingle-Clark model (olive). b) ‘3D ref’ at 280 km depth (horizontally dotted line in a), showing a lateral variability of two orders of magnitude in viscosity (1019–1021 Pa s). Present-day grounding line and calving front (Bedmap2 contours from Fretwell et al. (2013), grey and black respectively), and Zwally et al. (2012) drainage basin divide (red) between WAIS (basins 2–17) and East Antarctica (basins 18–27 and 1). c) Lithosphere depth defined by 1023.5 Pa s threshold (vertical dashed line in a), showing a thin lithosphere (< 50 km) in West Antarctica and a thick lithosphere exceeding 130 km in East Antarctica. 
Figure 8. Difference in relative sea level (a–c) and ice thickness (d–f) for different Earth structures at 15 kyr and 10 kyr BP, and RSL change rates at 10 kyr BP for the different Earth structures (g–i). The modelled grounding line position due to the different Earth structures are shown for ‘3D min’ (orange), ‘3D max’ (blue) and ‘3D ref’ (black). 
Figure 1. Schematics of coupled PISM Ice Sheet – PICO Ice Shelf – VILMA Solid Earth model components. Bedrock topography, relative sea level (RSL) and ice thickness are exchanged between VILMA and PISM in predefined coupling time steps. 
Figure 2. PISM-VILMA coupling scheme, adopted from Kreuzer et al. (2021). 
Figure 4. Anomalies of RSL (VILMA) and ice thickness (PISM) at present-day compared to Bedmap2 bedrock and ice thickness observations (Fretwell et al., 2013), for six iterations of coupled glacial cycle simulations with reference 3D Earth structure (n128) and sea level equation (n512), converging from 46 m RMSE to about 4 m RMSE for RSL anomaly (negative bed topography anomaly). This procedure does not optimize for the present-day ice thickness. The iterations show a convergence with alternating sign in mean RSL anomaly, particularly in the Siple Coast region in the Ross Sea sector. 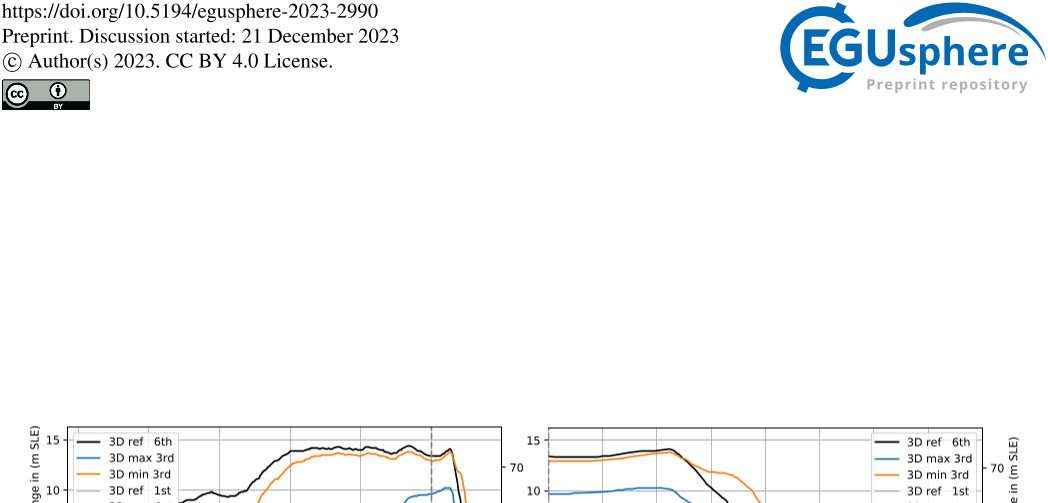
Figure 7. Sea level relevant Antarctic ice volume and grounded ice area over last 123 kyr and over last 20 kyr for different Earth structures. Blue and orange lines show the response of the Antarctic Ice Sheet in case of the ‘3D min’ and ‘3D max’ (cf. Fig. 5 a), which means respective 1D Earth structures south of 60°S and 3D further north. Black lines indicate the ice sheet response to ‘3D ref’, i.e. 3D also at Antarctica. Transparent lines show the first iteration results with same initial topography; dotted horizontal line is present-day observation from Bedmap2 (Fretwell et al., 2013).


References
Preliminary reference earth model
TL;DR: In this paper, a large data set consisting of about 1000 normal mode periods, 500 summary travel time observations, 100 normal mode Q values, mass and moment of inertia have been inverted to obtain the radial distribution of elastic properties, Q values and density in the Earth's interior.
10.5K
Four decades of Antarctic Ice Sheet mass balance from 1979-2017.
Eric Rignot,Eric Rignot,Jeremie Mouginot,Jeremie Mouginot,Bernd Scheuchl,Michiel R. van den Broeke,Melchior van Wessem,Mathieu Morlighem +7 more
TL;DR: During the entire period, the mass loss concentrated in areas closest to warm, salty, subsurface, circumpolar deep water (CDW), consistent with enhanced polar westerlies pushing CDW toward Antarctica to melt its floating ice shelves, destabilize the glaciers, and raise sea level.
Ice sheet grounding line dynamics: Steady states, stability, and hysteresis
TL;DR: In this paper, the results of boundary layer theory for ice flux in the transition zone against numerical solutions that are able to resolve the transition zones were verified. But the results were not applied to the large-scale dynamics of a marine ice sheet.
Exceeding 1.5°C global warming could trigger multiple climate tipping points
David I. Armstrong McKay,Arie Staal,Jesse Abrams,Ricarda Winkelmann,Boris Sakschewski,Sina Loriani,Ingo Fetzer,Sarah Cornell,Johan Rockström,Timothy M. Lenton +9 more
TL;DR: This paper provided a revised shortlist of global core and regional impact tipping points and their temperature thresholds, including the tipping point thresholds, time scales, and impacts of climate change, and provided an updated assessment of the most important climate tipping elements and their potential tipping points.
West Antarctic ice sheet and CO 2 greenhouse effect: a threat of disaster
TL;DR: In this article, it was shown that a 5 m rise in sea level at lat 80°S could start rapid deglaciation of West Antarctica, leading to a 5m rise in the sea level.
1K